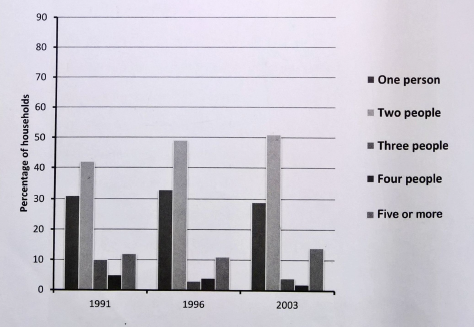
The chart illustrates the variation in occupant/ numbers, ranging from one person to the or above, in a single house in an area in North London over three different years.
Throughout the graph, accommodation for two people is clearly the most common and has an increasing trend, rising from just under 40% in 1991 to over half of all household types by 2003.
People living alone was the second most favoured form of accommodation; in 1991, over 30% of houses had only one occupant, and by 1996 this accounted for almost a third of all accommodation types. However, by 2003, this trend had decline, falling below 30%.
Over the three periods given, there were minor changes in the remaining three types of accommodation; houses with three or four people tended to decline, where the number of households with five or more people fluctuated between approximately 12% to 15%.