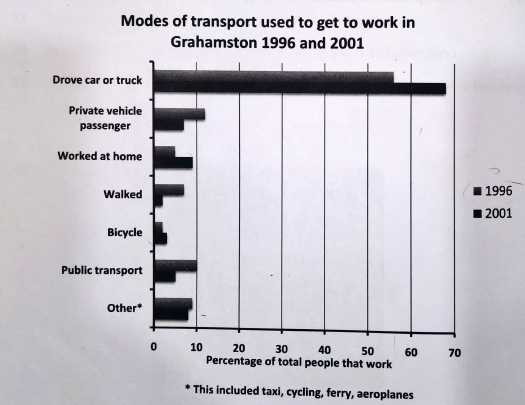
The chart shows the ways in which people travelled to work in 1996 and 2001 in Grahamston.
ln 1996, over half travelled to work in their own vehicle and the second most common method was to be driven as a passenger. The least common form of transport for the first period given was traveling by bicycle. One tenth of people travelled by public transport; just under 10% used ‘other forms and around 6% walked to work. 5% required no form of transport to get to work as they worked from home.
There was an increase of just over 10% of those who drove themselves to work by 2001, while the percentage of passengers almost halved. There was a significant decrease in the percentage using public transport, whereas, those working from home almost doubled. The percentage of people who walked to work fell dramatically while those using bicycle or ‘other’ means of transport remained fairly stable. In both periods given, driving independently to work was by far the most common method of transport remain fairly stable.