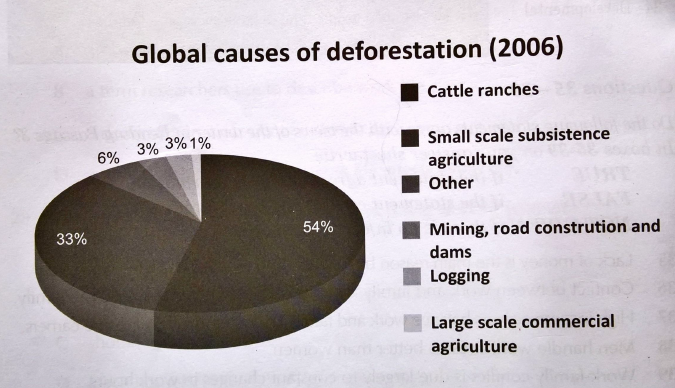
The pie chart given details 6 areas responsible for the reduction in forested area around the globe, ranging from infrastructure and mining to farming related industries, and with an additional category labeled as ‘other’.
The most notable point on the chart is that the majority of damage was due to cattle ranches, which accounted for over half of the total. Agricultural concerns then played the next most significant part, with smaller farms representing just under one third of the total. In comparison, larger agricultural production accounted for only 1%.
Mining and construction, as well as logging, were the second lowest causes of deforestation, accounting for only 3% each, the only two causes given that were equally responsible. This left a remaining 6%, expressed here under the umbrella term of ‘other’.