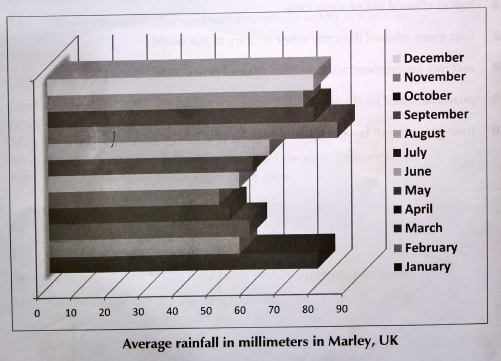
The chart illustrates the average amount of rain, measured in millimetres, that falls each month in Marley in the United Kingdom.
It is notable from the chart than even in the driest months, at least 50 millimetres of rain falls. Least rainfall is recorded for the month of May, with April being next at just under 55 millimetres, lune and February have approximately the same level of rain, with slightly over 55 millimetres.
Between May and August, the amount of rainfall increases by about 5 millimetres each month before increasing significantly in September. At approximately 85 millimetres September is the wettest month, with over 5 millimetres more rain than the second wettest month of January.