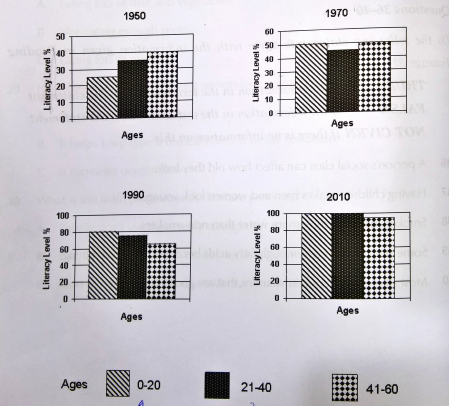
The four graphs show the literacy rate changes amongst three age categories from 1950-2010 in an African country.
In 1950, it is clear that the youngest age group (0-20) is the lowest in terms of literacy (around 25%). The next group (21-40) showed a significantly higher percentage than their younger countrymen with the oldest group (41-60) having the highest literacy rate (40%)- The 1970 graph indicates a dramatic change in the literacy rates of the 0-20 age group (from around 25% to 50%). The other two age groups also increased but not so dramatically (21-40 to 45% and 41-60 to 50%).
1990 saw continued growth in all three age groups. For the first time, the youngest age group (0-20) led the literacy rates (8096) with 21-40 (around 7596) and 41-60 (around 6596) following behind. 2010 shows that a very healthy improvement in literacy rates across all age groups is expected. Both 0-20 and 21-40 expect a 100% literacy rate with 41-60 showing around 9596 - an excellent future result!