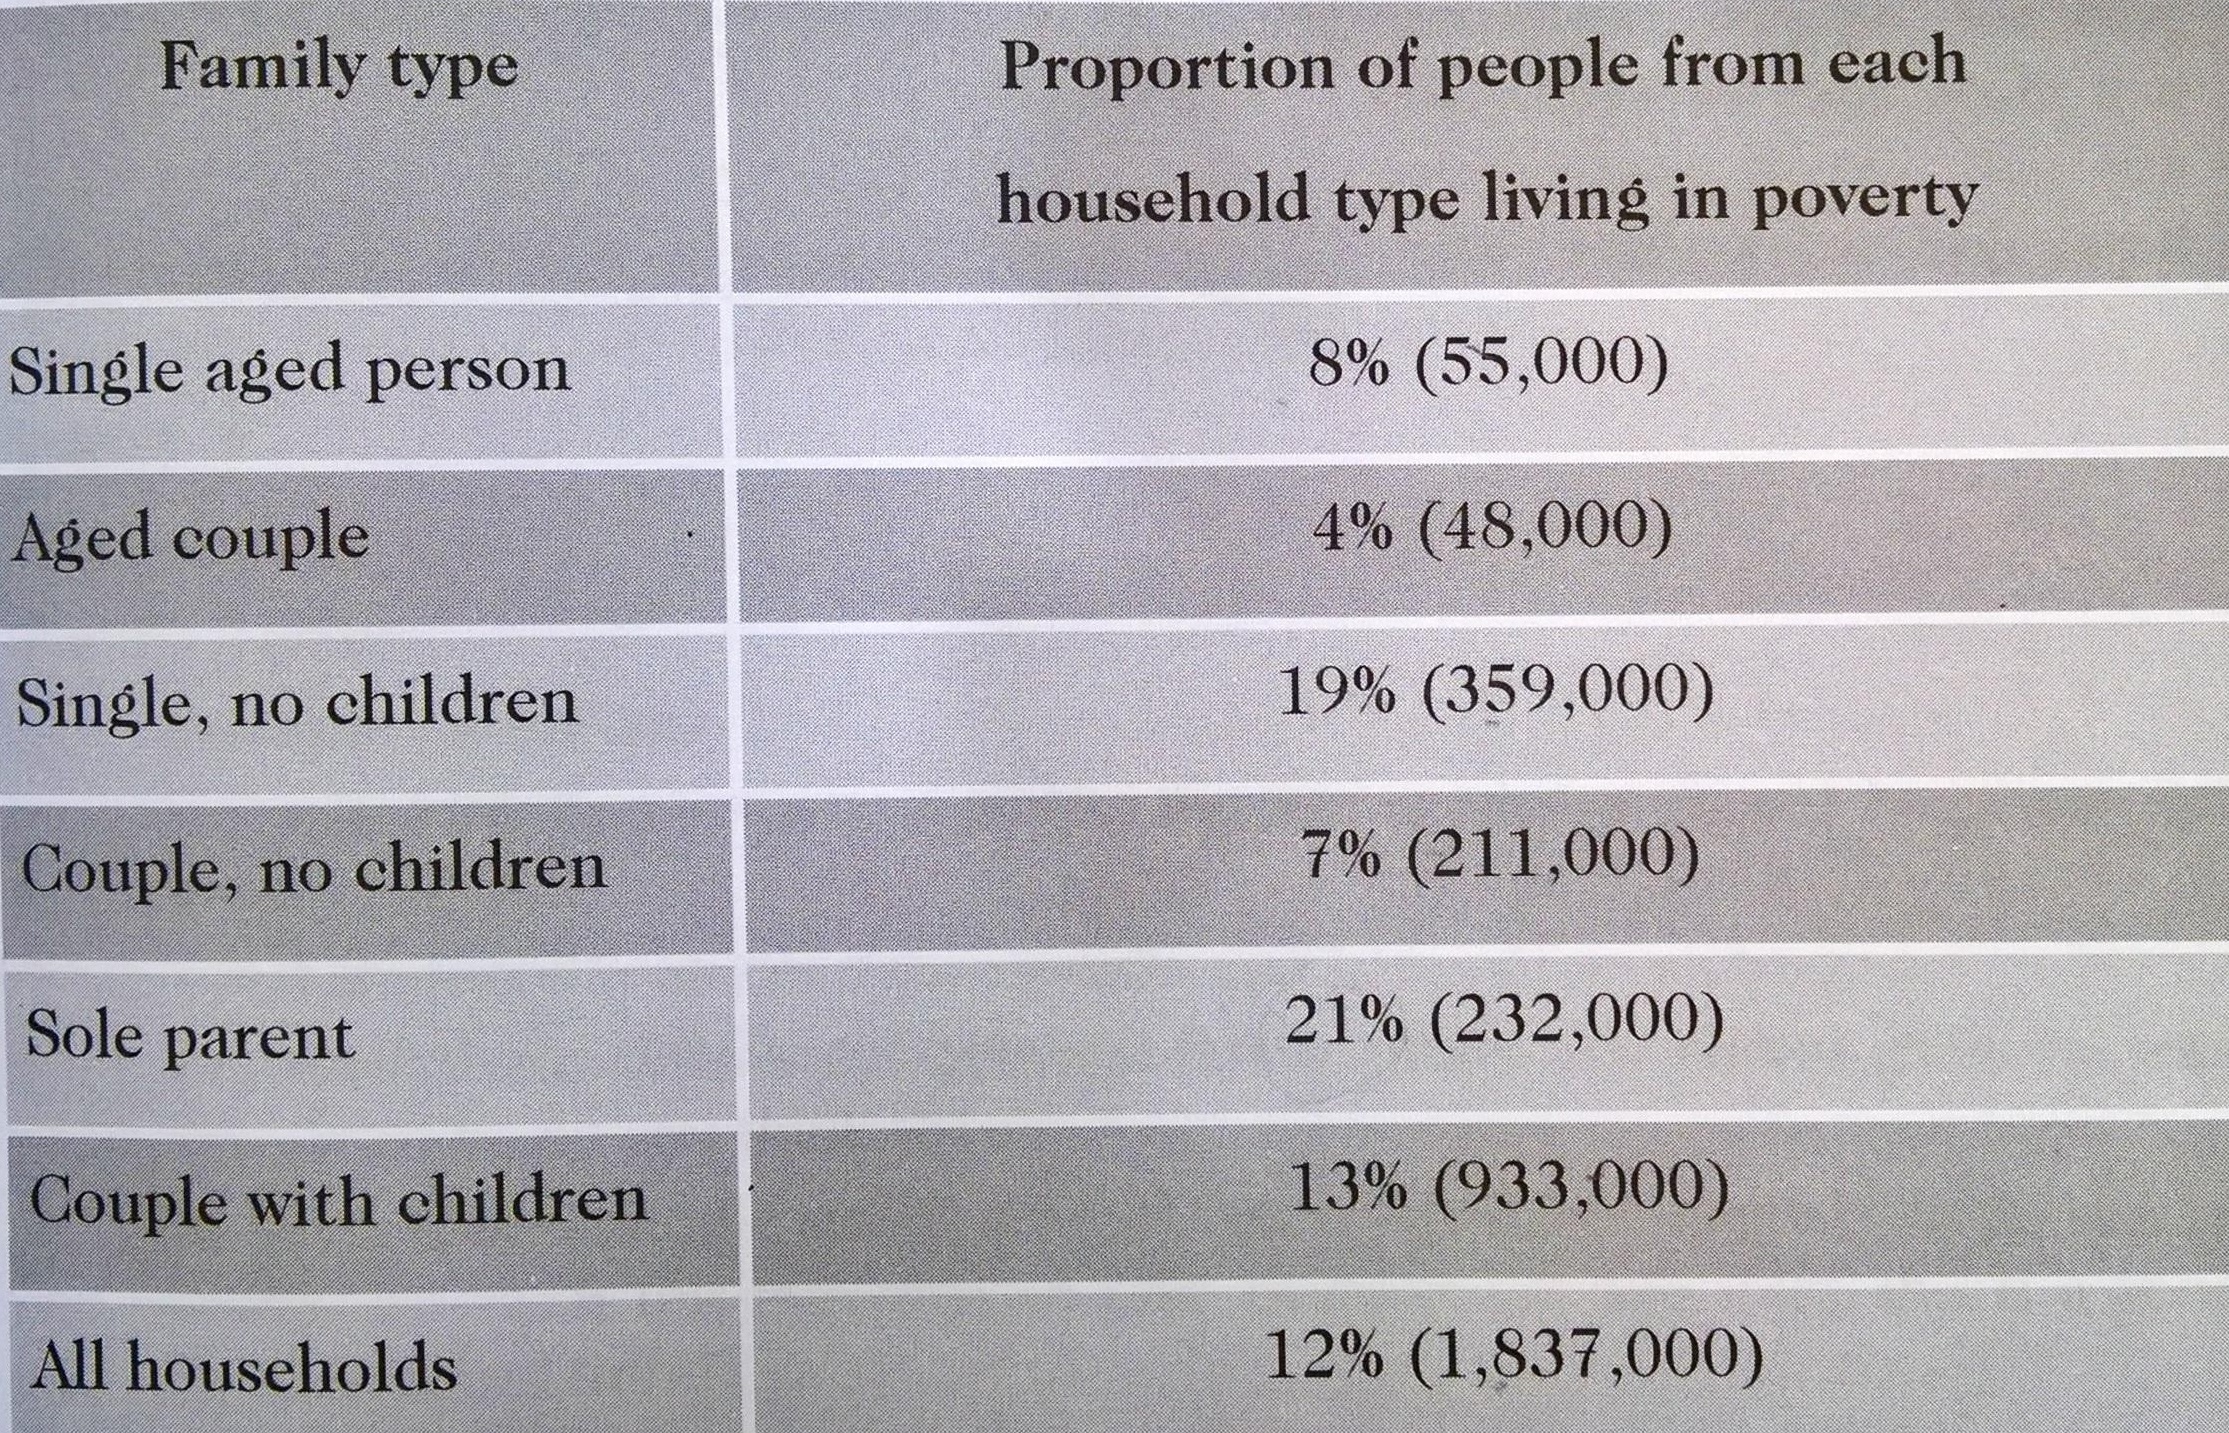
The table chart unfolds the different percentages of Australian families living under the poverty line in 1999. Those families include single aged person, aged couple, single family without children, couple without children, sole parent, and couple with children.
Generally speaking, among these six family types, there was only 12% (1,833,000) living in poor conditions. In detail, we can know that single families without children and sold-parent families shared almost the same percentages of 19% (369,000) and 21% (242,000), far more than that of aged couple of 4% (58,000). The percentage of single aged person was approximately equivalent to that of couple with children, respectively 8% (51,000) and 7% (212,000). Finally, the situation of the family of couple with children (13%) was slightly higher than that of the average (12%).