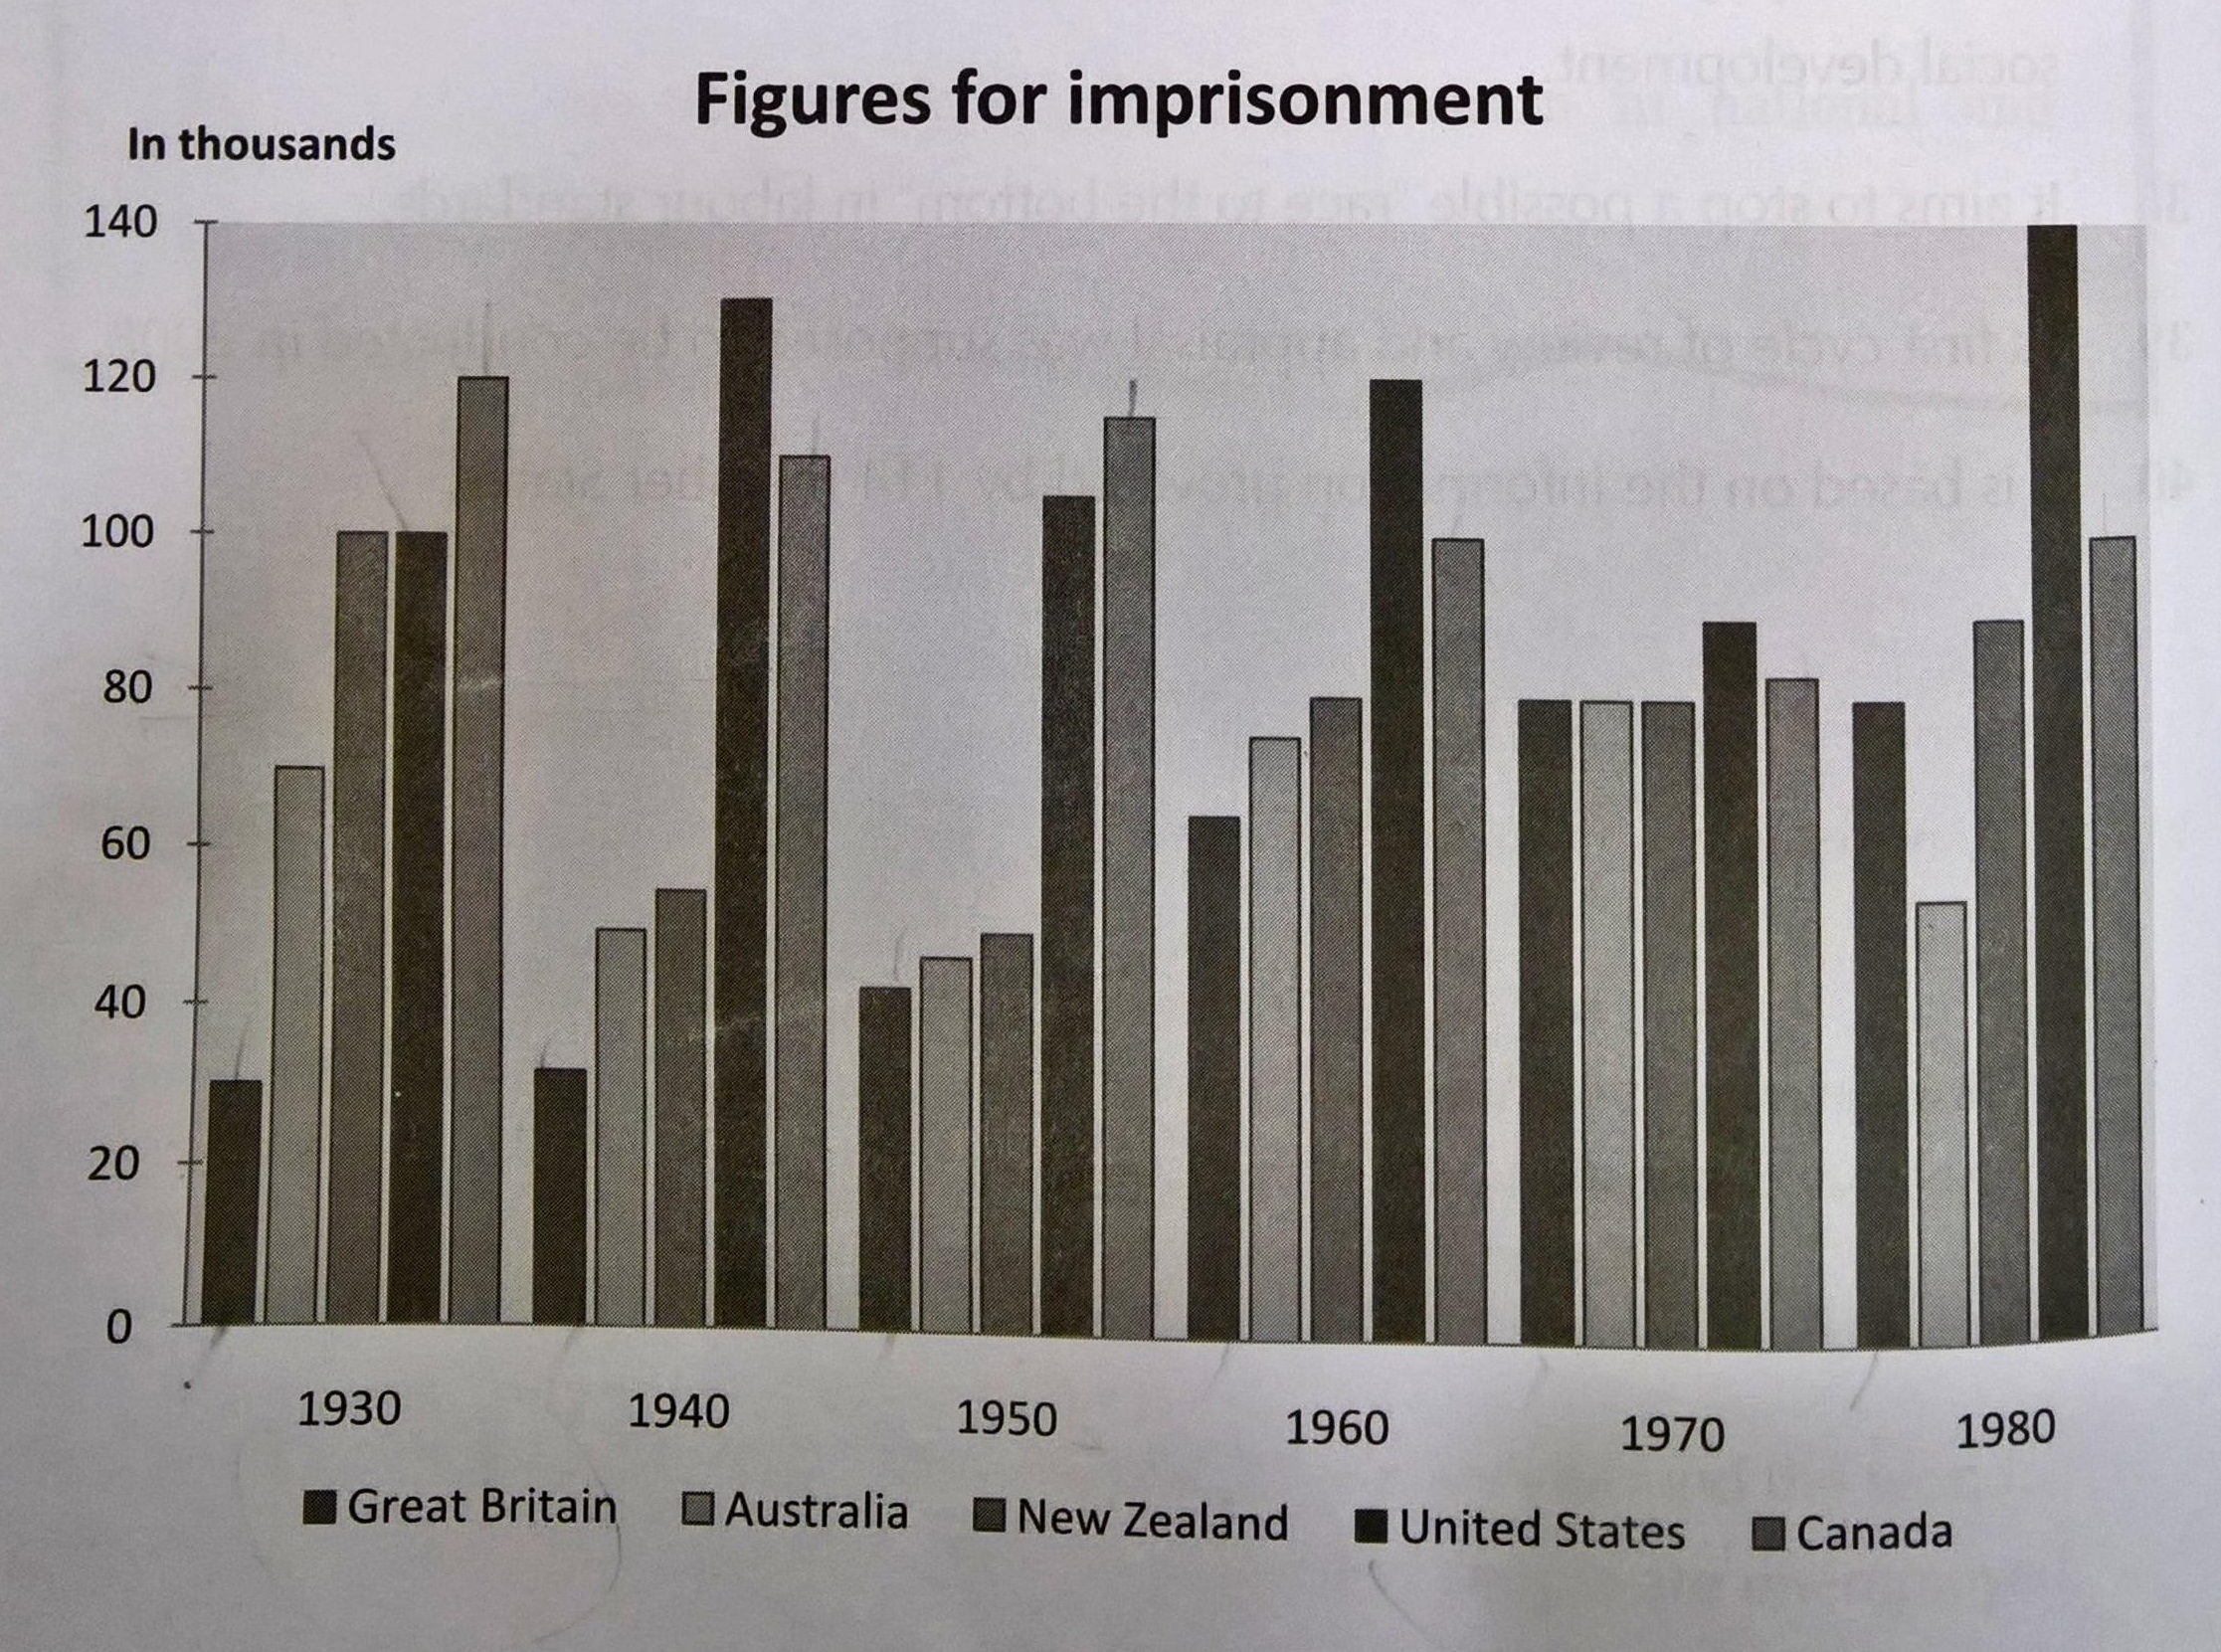
The bar chart compares the numbers of prisoners in five countries from 1930 to 1980.
There was a gradual increase in the number of prisoners of Great Britain from 30,000 in 1930 to 80,000 in 1980. The number of Australia fell rapidly from 1930 to 1940, increased gradually to 1970 and then decreased sharply to 1980. The number of New Zealand dropped sharply from 1930 to 1940, but then increased gradually to 1980.
The number of the United States rose sharply from 1930 to 1940, and then decreased to 1950. The number decreased from 1960 to 1970, and then increased to 1980. The number of Canada decreased slightly from 1930 to 1940, and then increased slightly to 1950. The number decreased from 1960 to 1970, and then increased to 1980.