.
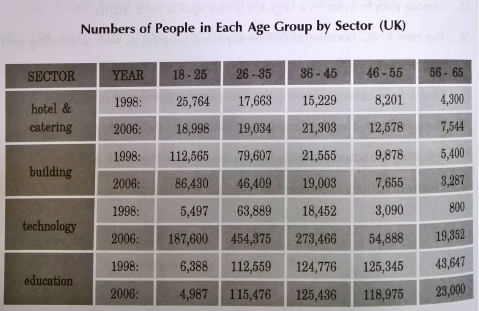
The table shows how many people worked in certain sectors in the UK in 1998 and in 2006. In some of the sectors there have been significant changes to both the age groups and the total numbers working.
In hotel and catering. the age profile of workers used to be much younger in 1998, with the majority of workers being under 35. In 2006. the majority of workers were between 26 and 45, with more workers in the over-46 category than in 1998 and fewer in the under 25s. The building industry had fewer workers overall in 2006 though it retained a similar age profile to that of 1998. The technology industry has seen enormous change with substantially more workers now than in 1998, but the vast majority of these were still in the 26- 35 age band, as they were in 1998. In education, numbers have not changed that much within each age category, although there are now fewer workers in the over-56 age group.
